magrittr - Piping
Last updated on 2023-02-23 | Edit this page
Overview
Questions
- How do you use pipes in R with magrittr`?
Objectives
- …
Introduction
Magrittr Logo
Look at magrittr
Challenge 1: Can you do it?
What is the equivalent of using pipes
R
f(x)
R
x %>% f
Challenge 2: Can you do it?
Can you rewrite the following with pipes to make it easier to read?
R
carData <-
 transform(
 aggregate(
 . ~ cyl,
 data = subset(mtcars, hp > 100),
 FUN = function(x) round(mean(x), 2)
 ),
 kpl = mpg*0.4251
 )
R
carData <-
mtcars %>%
subset(hp > 100) %>%
aggregate(
. ~ cyl,
data = .,
FUN = . %>% mean %>% round(2)
) %>%
transform(kpl = mpg %>% multiply_by(0.4251))
Plotting
- TODO: move to new epsiode, add epsidoe to config.yaml
Challenge
Can you display an image
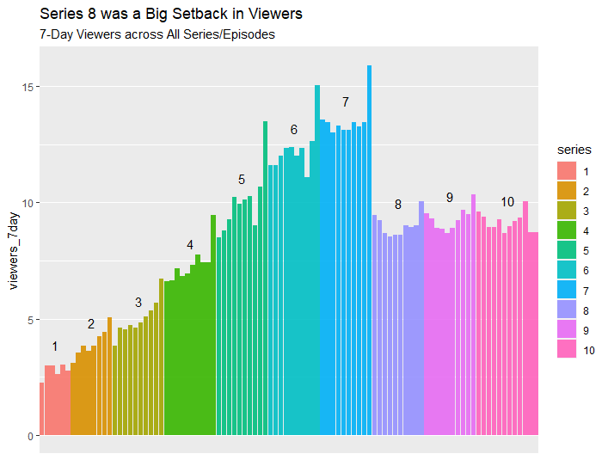
This is a cool plot. Adapted from https://alison.netlify.app/rls-plot-twist/
Key Points
- magrittr is cool